How Much Sugar Should Kids Have? Recommended Limits by Age
Advice on sugar intake by age is simple once you see it in one place. The AHA says kids aged 2 to 18 should stay under 25 g of added sugar a day, which is about 6 teaspoons. Kids under 2 should get none. In the UK, the NHS sets free sugar limits of 19 g at ages 4 to 6, 24 g at 7 to 10, and 30 g from age 11 up.
That is the short answer. The rest of this guide turns those numbers into things you can actually spot in a lunchbox.

Why the sugar rules change with age (and why the words matter)
Health bodies do not count all sugar the same way. They target the sugar that gets added to food, not the sugar that comes built into whole fruit, milk, or plain veg. Get this part right and the rest of the numbers make sense.
Three terms show up on the guidance pages, and they nest inside each other:
- Total sugars. Every sugar in the food. This includes the natural sugar in an apple or a glass of plain milk.
- Free sugars. The term the NHS and the WHO use. It covers sugar added by a cook or a factory, plus the sugar in honey, syrup, and fruit juice.
- Added sugars. The term the AHA, the CDC, and the FDA use. It is close to free sugars, though 100 percent fruit juice sits outside it in the US label rules.
So the added sugar vs natural sugar split is not about health halos. It is about where the sugar came from. Juice is the tricky one. The WHO counts fruit juice as a free sugar, because crushing fruit frees the sugar from the fibre that used to slow it down.

Age changes the number for one plain reason: a smaller body eats fewer calories. The WHO writes its rule as a share of energy rather than a fixed weight. Free sugars should stay under 10 percent of daily energy, and dropping under 5 percent may help more. At 2,000 calories a day, 10 percent works out at 50 g, or roughly 12 level teaspoons.
The NHS turns that same 5 percent target into plain grams for each age band. The AHA takes a blunter route and gives one flat cap for every child over 2. Both routes land in the same place: a small daily budget that most kids blow through by mid morning.
Sugar intake by age: the full chart
Here is the whole thing in one table. Grams and teaspoons sit side by side, so you never have to do the math twice. One teaspoon of sugar weighs about 4.2 g, so the rough rule is grams divided by four.

| Age band | AHA (US), added sugar | NHS (UK), free sugars | WHO | In teaspoons |
|---|---|---|---|---|
| Under 12 months | None at all | No sugar needed | Under 10 percent of energy, ideally under 5 percent | 0 |
| 1 year | None at all | 10 g | Same rule as above | 0 to about 2.5 |
| 2 to 3 years | Under 25 g | 14 g | Same rule as above | About 3.5 to 6 |
| 4 to 6 years | Under 25 g | 19 g | Same rule as above | About 5 to 6 |
| 7 to 10 years | Under 25 g | 24 g | Same rule as above | About 6 |
| 11 to 18 years | Under 25 g | 30 g | Same rule as above | About 6 to 7 |
| Adult women | 25 g | 30 g | 50 g ceiling, 25 g ideal | About 6 |
| Adult men | 36 g | 30 g | 50 g ceiling, 25 g ideal | About 9 |
| Older adults, 65 plus | Same as other adults | Same as other adults | Same as other adults | About 6 to 9 |
Two things jump out of that kids sugar intake chart. First, the US and UK numbers are close but not equal, because they count juice differently and build the limit differently. Second, nobody's limit ever climbs very high. A grown man gets 9 teaspoons. A 7 year old gets 6.
If you want your own child's number rather than a band, the Kids Sugar Intake Calculator works it out from age and shows the result in grams, teaspoons, and cubes.
Why the US and UK numbers do not match
Two countries, two sets of numbers, and both are correct. The difference is method, not disagreement.
The AHA works from a calorie ceiling. It caps added sugar at 100 calories a day for children, and 100 calories of sugar weighs 25 g. That is why a 3 year old and a 17 year old get the same figure. It is a floor built for simplicity, and simple rules get followed.
The NHS works from the WHO 5 percent target instead. It takes the average energy needs of each age group and turns 5 percent of that into grams. A 4 year old eats less than a 9 year old, so the 4 year old gets a smaller number. That is a more precise method and a harder one to memorise.
The other gap is juice. The NHS and the WHO count 100 percent fruit juice as a free sugar. The US added sugars line on a label does not include it. So a glass of orange juice moves the UK total and leaves the US label figure alone, even though it is the same glass.
Practical answer: pick the stricter of the two for your child's age and use it as one round number. For most families that means 25 g for school age kids and less for the under 7s.
Babies and toddlers under 2: the zero added sugar rule
This is the one age band where the guidance is not a number. It is a flat no.
The AHA states that children under 2 should have no added sugar at all. That advice comes from its 2017 scientific statement, Added Sugars and Cardiovascular Disease Risk in Children. The NHS puts it more plainly still: your baby does not need sugar.
The logic is about room, not danger. Babies eat tiny amounts. Every spoonful of sweet food crowds out something with iron, protein, or fibre in it. Taste habits also form early, and a child who learns that yogurt is sweet will push back on the plain kind later.
Here is what usually breaks the rule in real homes:
- Flavoured yogurt pots and pouches. Many kid versions carry roughly 6 g to 12 g of sugar per pot. Plain yogurt with mashed fruit stirred in gets you the same texture with none of it.
- Baby snack puffs and biscuits. Some are fine. Others list sugar, cane syrup, or fruit concentrate in the first three lines.
- Fruit juice. Even 100 percent juice counts as a free sugar. Whole fruit is the better swap at this age.
- Fruit purée pouches. The fruit is real, but sucking purée is closer to drinking juice than to eating an apple.
- Honey. The NHS says no honey before age 1, both because of infant botulism risk and because honey is sugar.
None of this means a first birthday cake ruins anything. It means the default, everyday food does not need to be sweet.
Swaps that hold up at this age:
- Plain full fat yogurt with mashed banana or berries instead of a flavoured pot.
- Water or plain milk instead of juice, squash, or flavoured milk.
- Soft fruit in the hand instead of a purée pouch, once your child can manage the texture.
- Plain oats with fruit stirred through instead of a flavoured instant packet, which often carries 8 g to 12 g.
- Cinnamon or vanilla when you want a food to taste sweeter without adding sugar.
One more note for this band. Toddlers are famously fussy, and the advice above can read as a lecture from someone who has never met a 20 month old. The realistic version is narrower: keep the drinks unsweetened and check the yogurt aisle. Those two habits carry most of the weight at this age.
Kids aged 2 to 8: where the sugar actually hides
From age 2, the AHA gives one number and sticks to it: under 25 g of added sugar a day, or about 6 teaspoons. It also suggests capping sugary drinks at one 8 oz serving a week.
Six teaspoons sounds workable until you price a normal day. Watch how fast the budget goes.
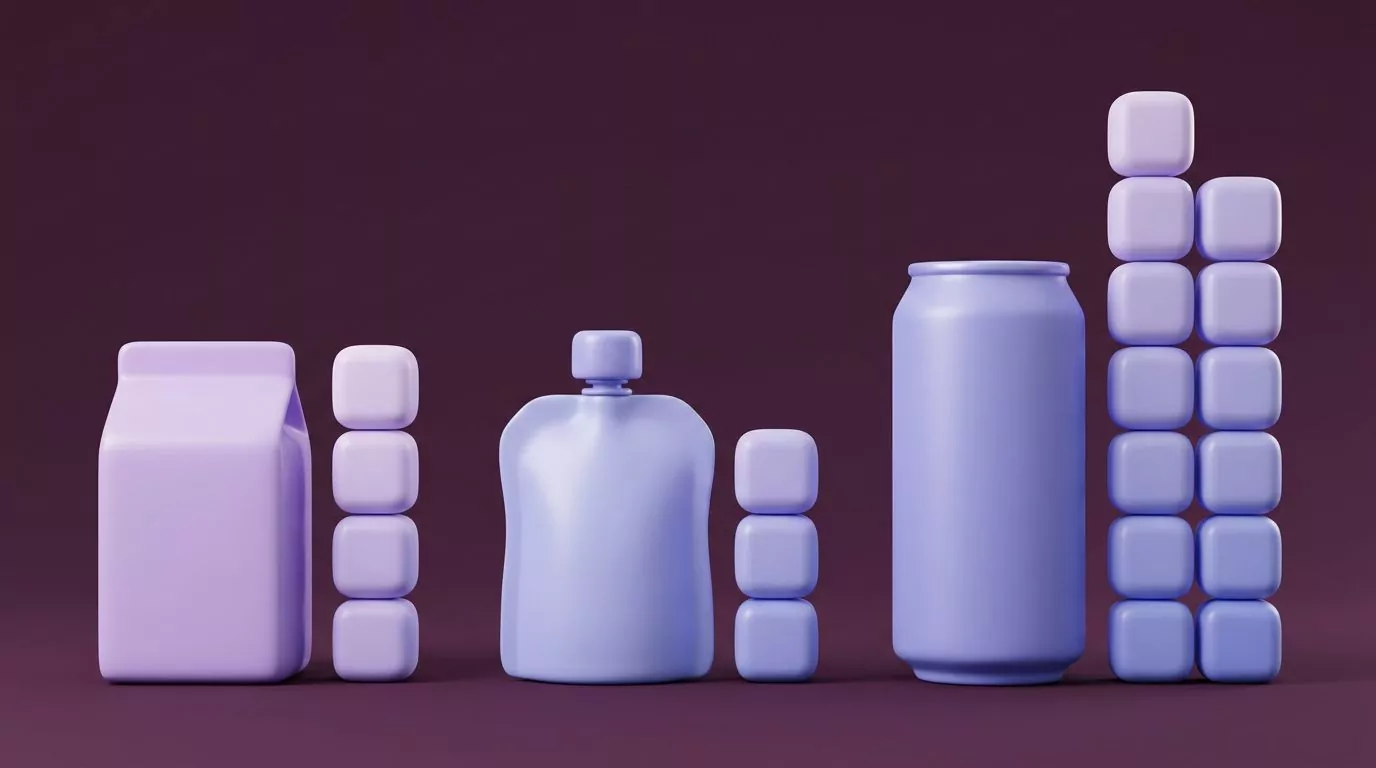
- One 6.75 oz juice box: about 16 g to 18 g of free sugars. That is most of a 4 to 6 year old's whole NHS allowance in one straw.
- One flavoured yogurt tube or pouch: roughly 6 g to 12 g, depending on brand.
- One small carton of chocolate milk: about 12 g of added sugar on top of the milk's own sugar.
- A bowl of sweetened cereal: often 9 g to 12 g per serving, and few kids pour a measured serving.
- One 12 oz can of regular cola: about 39 g, close to 10 teaspoons. That is over the daily limit for every age band in the table above.
Read that list again and you can see the trap. No single item looks reckless. Juice box plus yogurt pouch plus a bowl of cereal already runs past 25 g before school lets out.
The CDC has measured what this adds up to. In 2017 to 2018, US kids and young people aged 2 to 19 took in an average of 17 teaspoons of added sugar a day. The limit is 6. Even among 2 to 5 year olds, most groups averaged 11 to 13 teaspoons.
A normal day for a 5 year old, priced out
Numbers in a list are easy to wave off. A day laid end to end is harder to argue with. This is an ordinary weekday for a 5 year old, whose NHS limit is 19 g.
| When | What | Free or added sugar | Running total |
|---|---|---|---|
| Breakfast | Bowl of sweetened cereal with milk | About 10 g | 10 g |
| Mid morning | Small juice box at nursery | About 16 g | 26 g |
| Lunch | Yogurt tube in the lunchbox | About 8 g | 34 g |
| After school | Fruit snack pouch | About 10 g | 44 g |
| Dinner | Two spoons of ketchup | About 8 g | 52 g |
Nothing on that list is a treat. There is no cake, no sweets, and no soda. The day still lands near 52 g, which is close to three times the limit for that age.
Now change two lines. Swap the juice box for water and the sweetened cereal for a plain one with fruit. The day drops to roughly 26 g without touching the lunchbox, the snack, or dinner. That is the whole method in one move: find the two biggest items and change only those.
The fix is rarely a ban. It is usually one swap that removes several teaspoons at once, most often a drink. To check what a specific snack costs before you buy it again, the Sugar in Food Checker lists per serving figures for more than 120 common foods.
Tweens and teens aged 9 to 18: drinks do most of the work
Parents often expect the limit to rise once a child hits double digits. Under the AHA rule, it does not. The cap stays at 25 g of added sugar a day right through age 18.
The NHS is a little more generous here. From age 11, its free sugar limit becomes 30 g a day, the same as an adult's. That is roughly 7 sugar cubes.
So how much sugar should a 12 year old have a day? Call it 25 g to 30 g, depending on which guidance you follow. Either way, one can of soda uses the whole thing.
Teen intake is where the gap gets widest. CDC figures for 12 to 19 year olds show group averages of 14 to 20 teaspoons a day. That is two to three times the AHA number.
Drinks explain most of it:
- A 20 oz sports drink: roughly 34 g of added sugar, sold as a hydration product.
- A 16 oz energy drink: often 50 g or more, plus a large caffeine dose.
- A large sweetened coffee: can pass 40 g once syrup and whipped topping are in.
- A 12 oz can of soda: about 39 g, and rarely the only one in a day.
Two things make this age band harder than the younger ones. Teenagers buy their own food, so the shopping list stops being a control. And sweet drinks are marketed to them as sport, study, and energy rather than as dessert.
That framing is worth naming out loud. A sports drink is designed for long, hot endurance sessions. A 40 minute PE lesson is not one. Water does the job, and it does not spend a whole day's sugar budget on the way.
Lectures do not move teenagers much. Numbers sometimes do, because the size of the gap is genuinely surprising. Running a few of their usual drinks through the Sugar in Drinks Calculator shows the total in cubes and as a share of the daily limit, which lands better than a rule ever does.
A softer approach also tends to work better here. Rather than banning a drink, agree on a swap the teenager picks themselves: sparkling water at home, the smaller size when out, or soda on weekends only. Ownership of the rule matters more at 15 than the rule does.
Adults and older adults: the limit does not go up with age
Grown ups get a bit more room than children, but not much, and the number stops growing after that.
The AHA sets the adult limit at 25 g a day for women and 36 g a day for men. In teaspoons that is 6 and 9. Those figures come from its 2009 statement on dietary sugars intake and cardiovascular health. The NHS uses one flat 30 g figure for everyone aged 11 and up.
Anyone searching for the daily sugar intake for women will meet two answers, 25 g in the US and 30 g in the UK. Both are right. They come from different methods, and the gap is smaller than the gap between either number and how much people actually eat.
Which brings us to the honest part. The CDC found that US adults aged 20 and over averaged 17 teaspoons of added sugar a day, 19 for men and 15 for women. So the average man eats about double his own limit.
Older adults get no extra allowance either. There is no separate AHA or NHS band for people over 65. Appetite often shrinks with age while sweet foods stay easy to eat, so the same 25 g to 36 g range applies to a smaller total intake.
Two adult-only notes worth having:
- Alcohol is not counted in these limits. Mixers and sweet drinks still carry free sugars, and they are easy to forget.
- Anyone managing a health condition should ask their own clinician for a target. These are public guidelines for the general population, not a plan for a specific person.
How to stay under the number without a daily fight
You do not need to audit every meal. Most families are one or two habits away from the target, and the habits are usually liquid.
Read the added sugars line, not the total
US labels now break added sugars out on their own line. The FDA sets the Daily Value for added sugars at 50 g on a 2,000 calorie diet, and there is no Daily Value for total sugars at all. That is your cue to read the added line and ignore the rest.
UK labels work the other way. They show total sugars, and the NHS traffic light guide flags more than 22.5 g of total sugars per 100 g as high.
Convert grams to teaspoons in your head
Grams mean nothing to most people. Teaspoons mean something. Divide by four and you have it: 12 g is 3 teaspoons, 24 g is 6, 39 g is close to 10.
If you want the exact figure rather than the rough one, the Sugar Grams to Teaspoons Converter handles grams, teaspoons, cubes, and calories in one step.
Fix drinks first, then snacks
Drinks are the highest yield change because they carry a lot of sugar and almost no fullness. The NHS suggests capping juice and smoothies at 150 ml a day in total, and serving them with a meal rather than between meals.
A short list that tends to work:
- Move juice to mealtimes only, in a small glass, and offer water the rest of the day.
- Buy plain yogurt and add fruit yourself. This one swap often saves 8 g to 10 g a day.
- Keep soda and energy drinks out of the weekly shop, so they become an occasion rather than a default.
- Check one cereal box. Swapping a sweetened cereal for a plain one can save another 8 g every morning.
- Leave dessert alone. Cutting the invisible sugar first usually means you never have to police the visible kind.
Plan for parties, holidays, and grandparents
Every family hits the same three problems, and none of them are solved by a stricter rule at home.
Parties and holidays are short. A birthday, a trick or treat haul, or a week at the grandparents' house sits outside the daily average, and treating it as a crisis usually backfires. The guidance is about the ordinary week, which is where nearly all of the sugar lives.
Grandparents and other carers are trickier, because the sweets are affection. Framing helps more than rules do. Asking someone to make the drinks unsweetened is a small, specific request. Asking them to enforce a gram limit is not, and it will be quietly ignored.
School is the third one. Lunchboxes, class rewards, and after school clubs add sugar you never see. If a day looks fine at home and your child is still constantly reaching for sweet food, the missing grams are usually there.
Learn the aliases
Sugar has a lot of names on ingredient lists. Cane juice, dextrose, maltose, rice syrup, fruit juice concentrate, and agave nectar all count. Pasting an ingredient list into the Hidden Sugar Finder highlights more than 70 of these names at once, which is faster than learning them.
Track for one week, not forever
A single week of honest logging tells you where your household's sugar actually comes from. Almost nobody guesses right. Once you know the two or three items doing the damage, you can stop tracking and just change those.
Sugar Tracker's browser tools all run without a signup, and Sugar Lens, an iOS app that estimates added sugar from a photo of a meal, is in development. Both are awareness and tracking aids rather than medical tools, and every AI estimate is shown for you to confirm or correct before it is saved.
Frequently Asked Questions
How much sugar should a child have per day?
For children aged 2 to 18, the AHA says less than 25 g of added sugar a day, which is about 6 teaspoons. The NHS sets lower figures for younger children: 14 g at ages 2 to 3, 19 g at 4 to 6, and 24 g at 7 to 10. Children under 2 should have no added sugar at all.
Does fruit count toward the sugar limit?
Whole fruit does not. The sugar in an apple or a handful of berries comes packed with fibre and water, so it is not counted as free or added sugar. Fruit juice is different and does count, which is why the NHS caps juice and smoothies at 150 ml a day. If you want the numbers for specific fruits, the Fruit Sugar Chart covers more than 50 of them.
How many teaspoons is 25 g of sugar?
About 6 level teaspoons. One teaspoon of sugar weighs roughly 4.2 g, so dividing grams by four gets you close enough for label reading. By the same math, 36 g is about 9 teaspoons and 50 g is about 12.
Is honey better than sugar for kids?
Not for the purposes of these limits. Both the NHS and the WHO count honey as a free sugar, so it lands in the same daily budget as table sugar. Honey also should not be given to babies under 1 year old at all, because of the risk of infant botulism.
How much sugar should a 12 year old have a day?
Between 25 g and 30 g, depending on the guidance you use. The AHA keeps its 25 g limit in place through age 18. The NHS raises its free sugar limit to 30 g from age 11, the same as an adult's. One 12 oz can of soda, at roughly 39 g, passes both.
What is the maximum sugar intake per day for an adult?
The AHA sets it at 25 g for women and 36 g for men. The WHO frames it as under 10 percent of daily energy, which is 50 g at 2,000 calories, and suggests under 5 percent for extra benefit. The NHS uses a flat 30 g for everyone aged 11 and over.
Start with one number instead of nine
The chart above covers every age band, but you only need one row: the one your child is in. Get that single figure in your head and label reading becomes a two second job instead of a research project.
The Kids Sugar Intake Calculator gives you that number in grams, teaspoons, and cubes in under a minute, with no signup. If you want your own limit alongside it, the Daily Sugar Intake Calculator works it out from your calorie needs using the same WHO and AHA rules quoted throughout this guide.
This article summarises public guidance from the AHA, WHO, NHS, CDC, and FDA for general awareness. It is not medical advice. For questions about your own child's diet, growth, or health, speak to a pediatrician or another qualified healthcare professional.